SEO Reporting Dashboard: Making Sense of Your Website's Performance

Remember the days of scrambling through multiple browser tabs just to figure out how your website was doing? Tracking rankings in one place, traffic in another, and backlinks somewhere else entirely? Yeah, those weren't the good old days.
Think of an SEO reporting dashboard like your car's dashboard. You wouldn't want separate displays scattered throughout your vehicle just to check your speed, fuel level, and engine temperature. The same logic applies to monitoring your website's performance.
Let's break down why these dashboards matter and how to actually use one without drowning in data.
Why Bother With an SEO Dashboard?
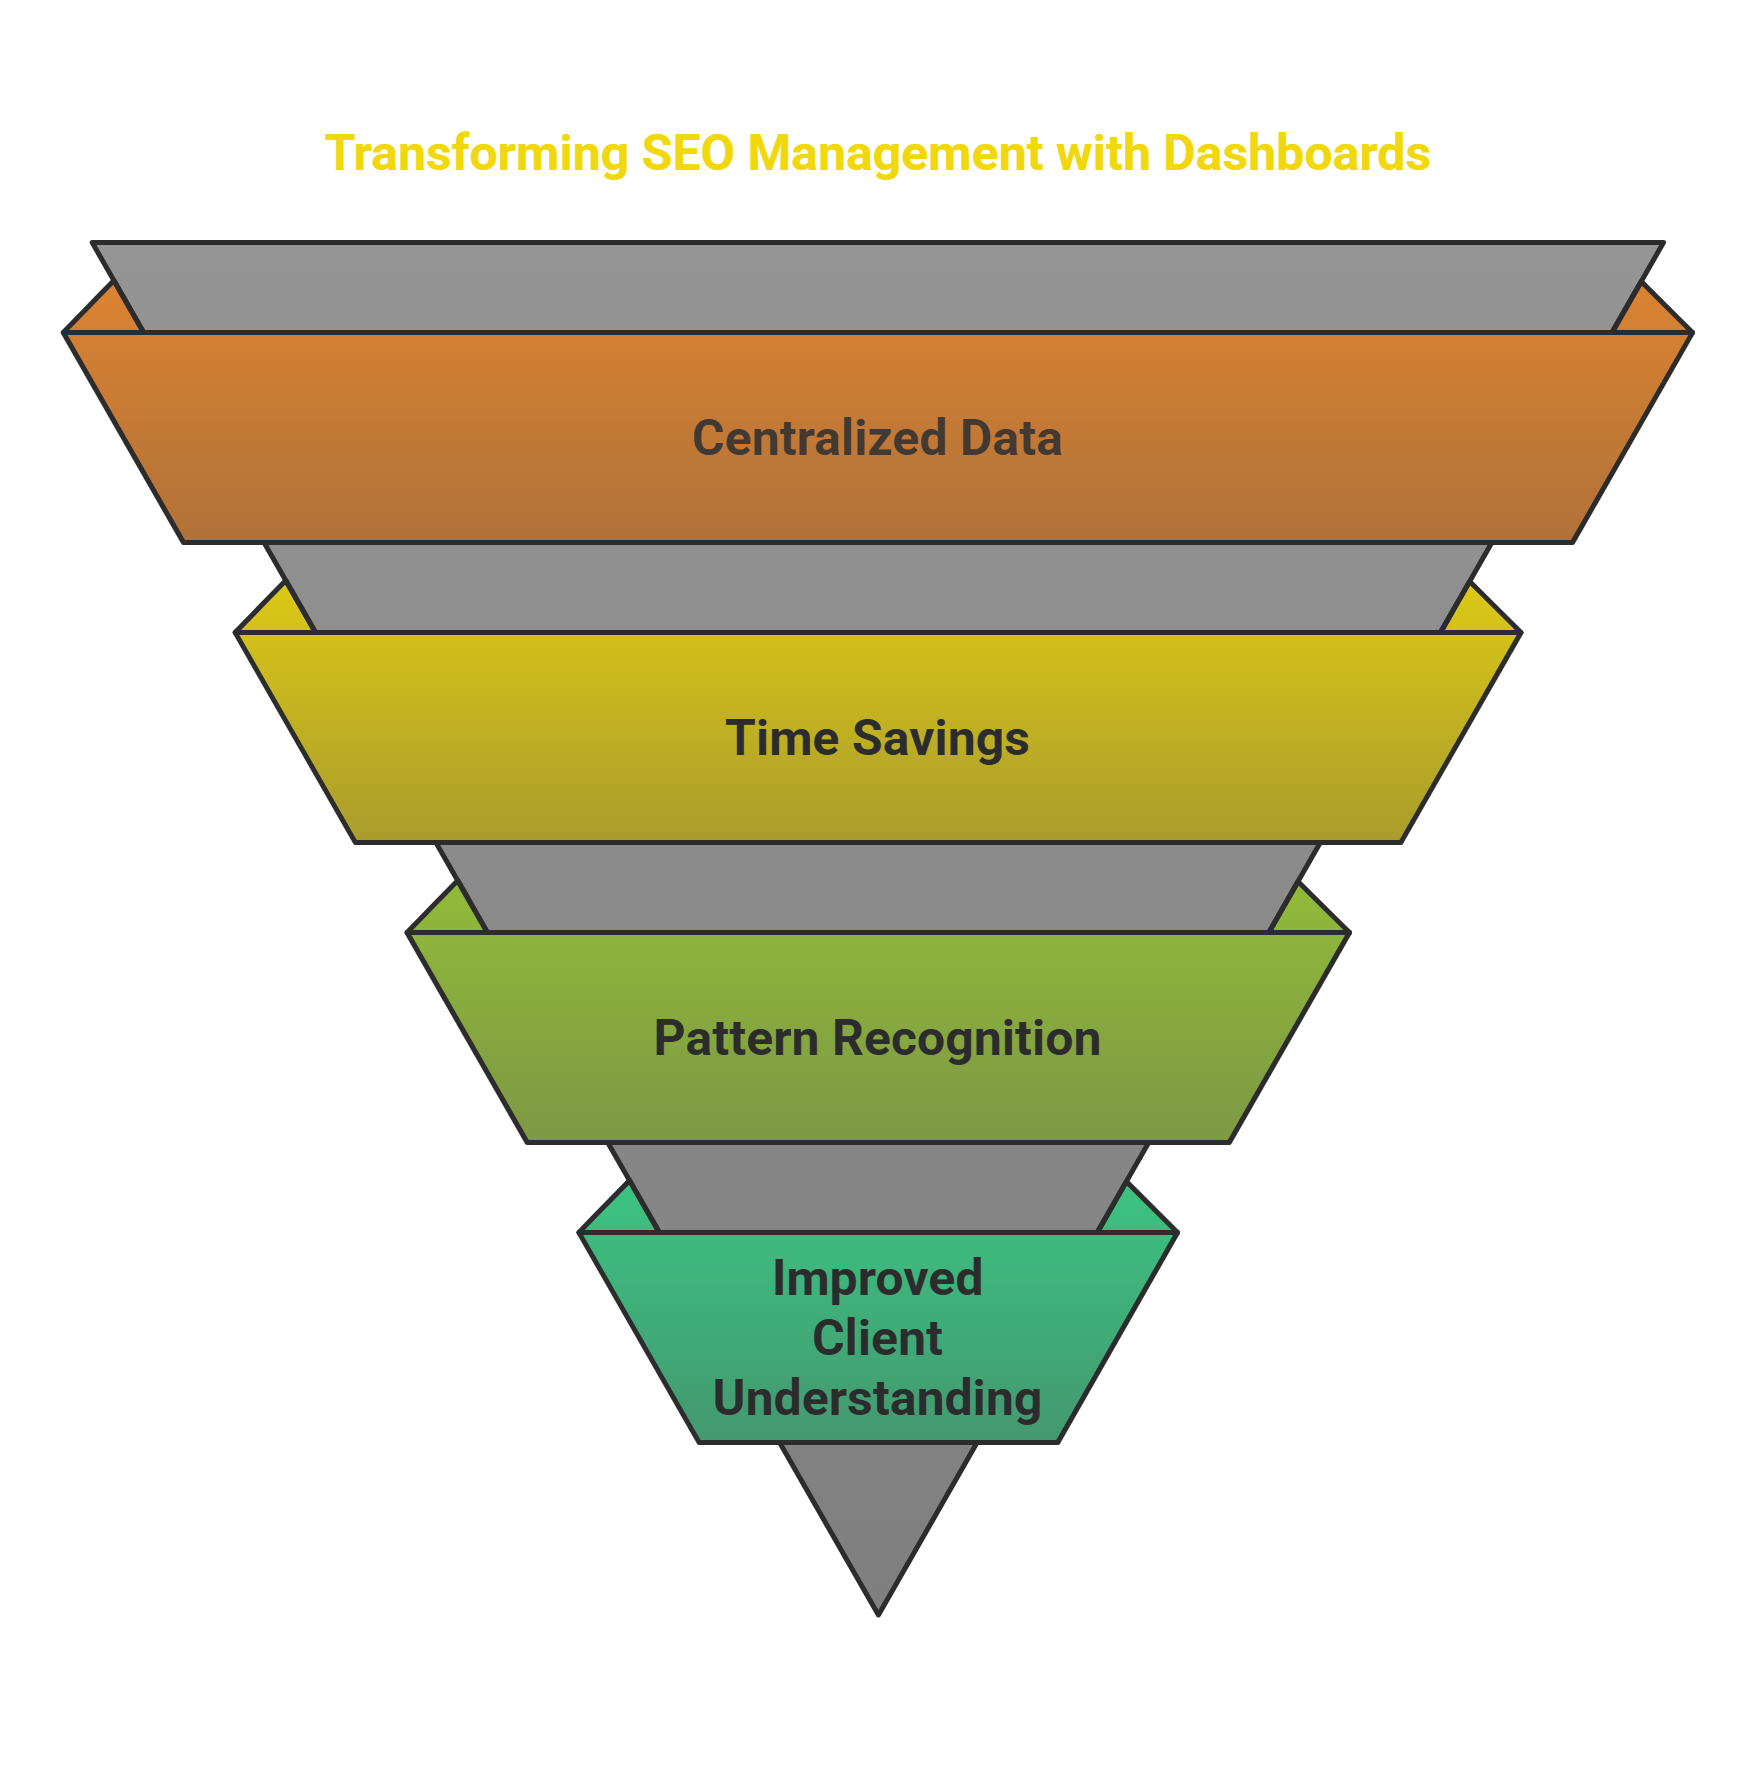
Everything Lives in One Place
I used to spend Friday afternoons pulling reports from Google Analytics, then Search Console, then our backlink tool, then trying to make sense of it all in a spreadsheet. Now? One dashboard, one screen, everything I need to see.
You'll Get Your Time Back
Last month, I tracked how long our team spent manually creating client reports: 14 hours. After setting up proper dashboards? Under 2 hours. That's 12 extra hours for actual strategy work.
Patterns Become Obvious
When Sarah from our team spotted a sudden traffic drop to our product pages, it wasn't because she was meticulously reviewing spreadsheets. The dashboard's visualization made the drop jump out instantly, and we fixed the broken filter that was causing it before it became a bigger problem.
Clients Understand What You're Showing Them
Remember trying to explain complex SEO metrics to clients using spreadsheets? Remember their glazed-over eyes? Yeah, dashboards with clear visualizations solve that problem.
What Makes a Dashboard Worth Using?
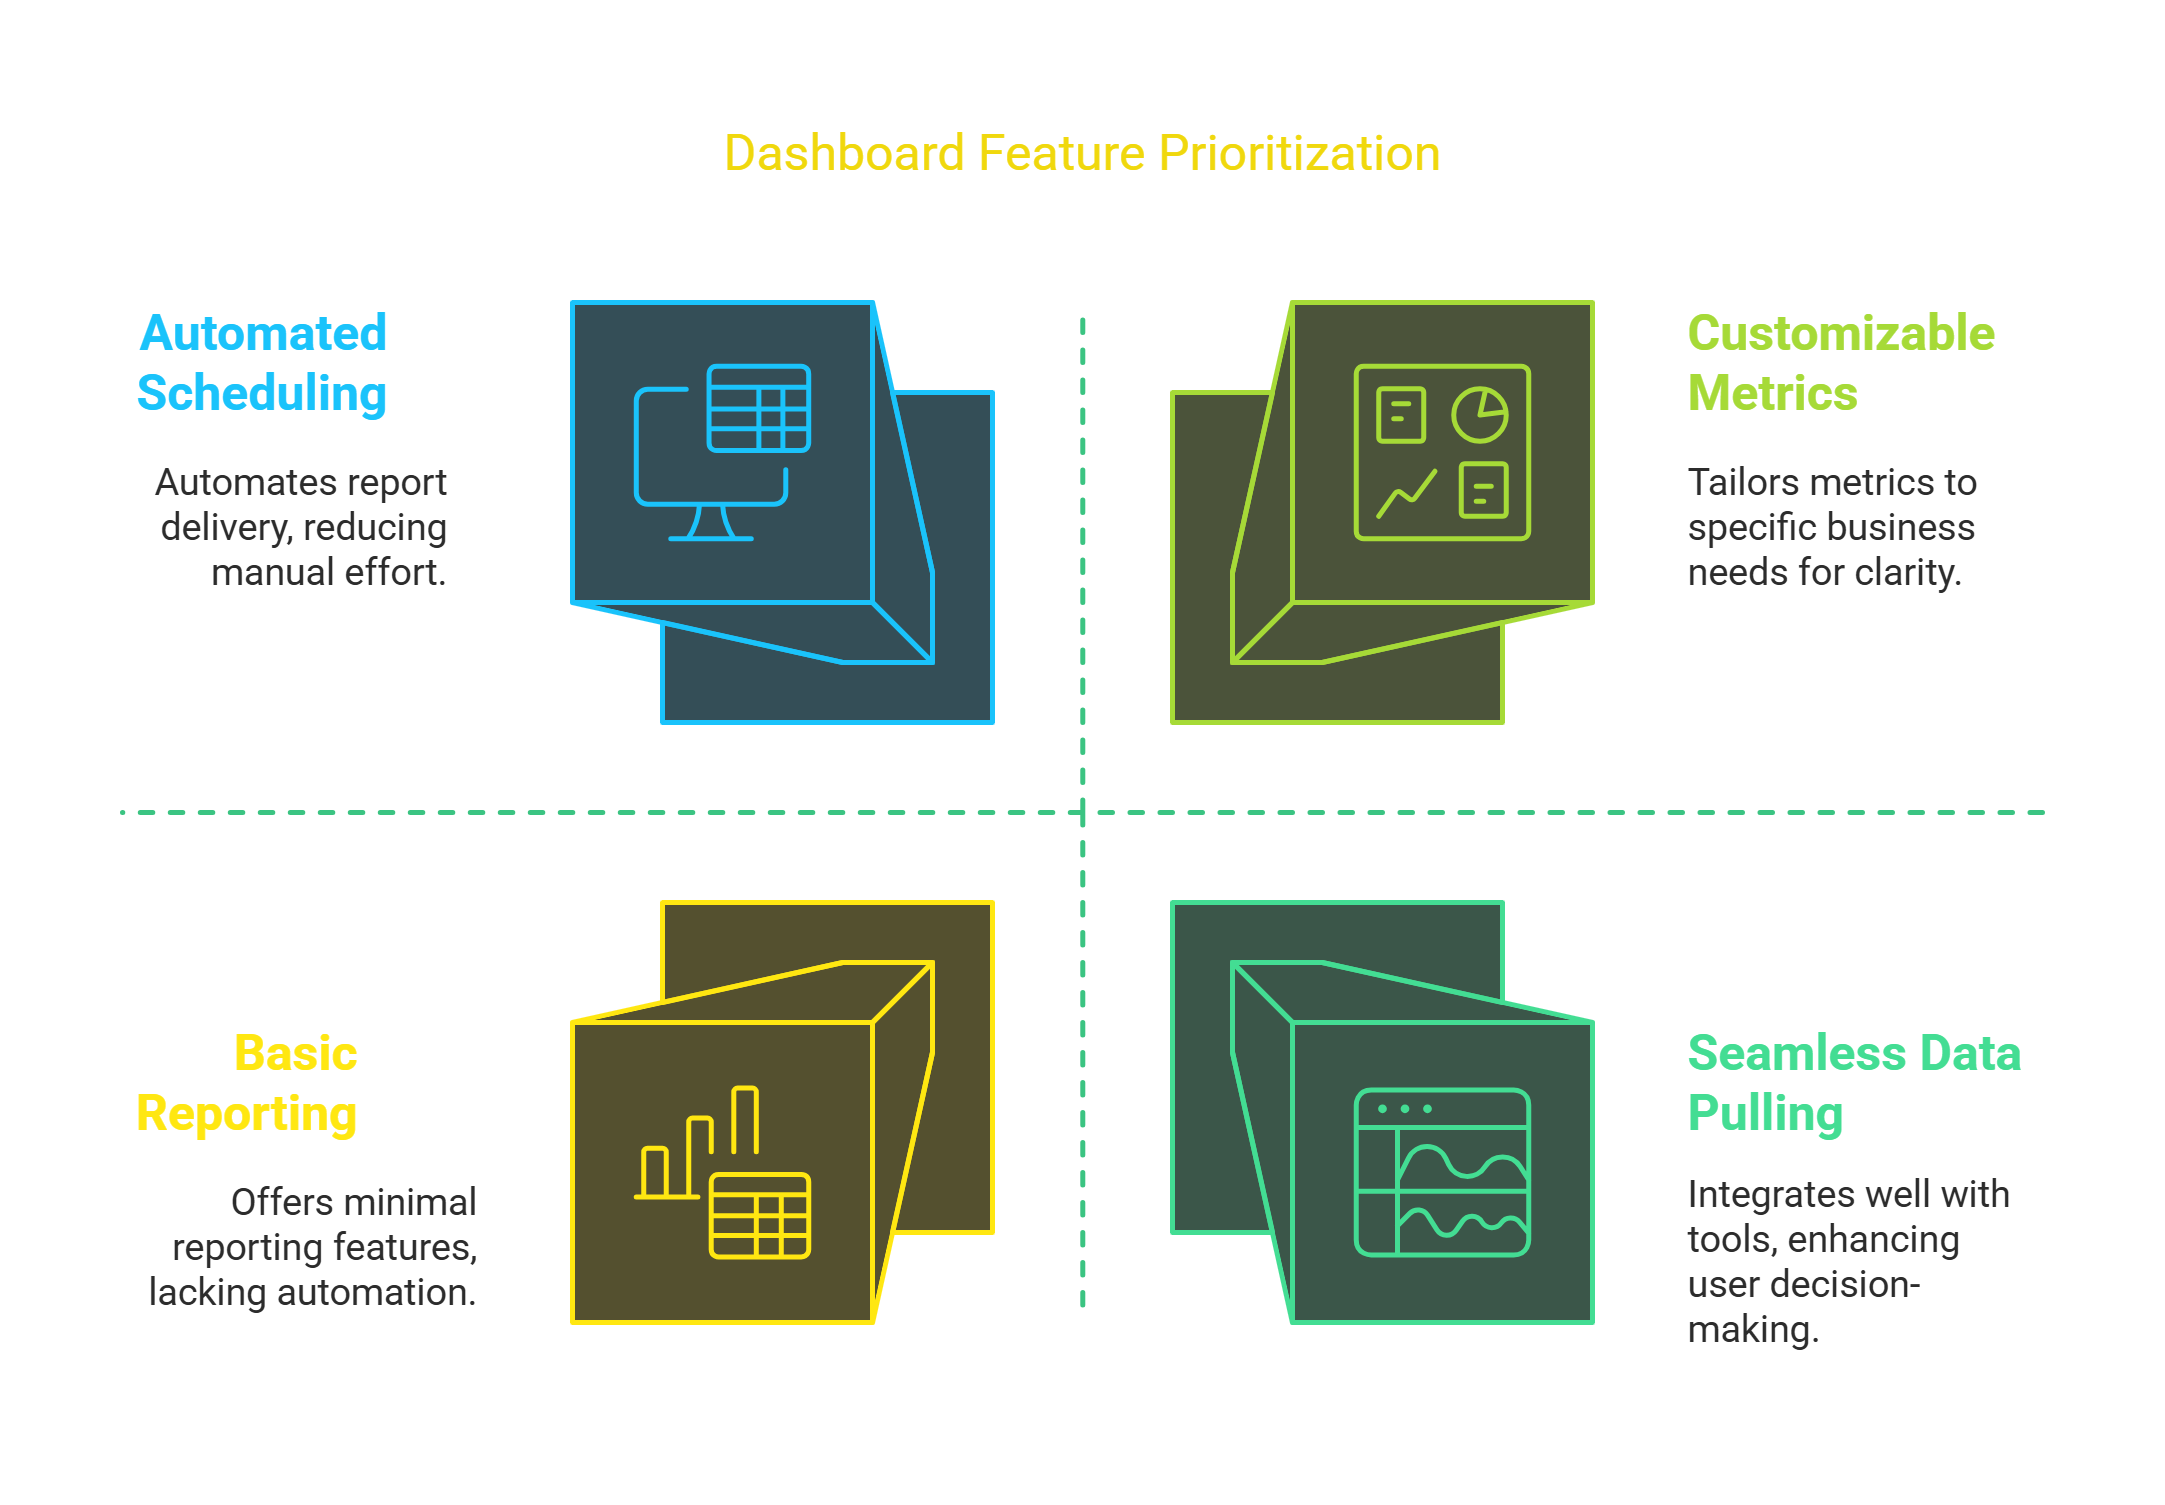
Customization That Matters
Your local bakery needs different metrics than an enterprise software company. Pick what matters to YOUR business, not what some template tells you to track.
Plays Nice With Your Other Tools
A good dashboard pulls data seamlessly from:
- Your Google Analytics account
- Search Console data
- Backlink monitoring tools
- Your rank tracking software
Shows You Fresh Information
Checking last month's data to make today's decisions is like driving using only your rearview mirror. Good dashboards update frequently enough to be actionable.
Visually Makes Sense
I've seen dashboards that looked like someone threw a bucket of numbers at the screen. Charts and graphs shouldn't require a statistics degree to understand.
Creates Reports Without You Babysitting It
The best dashboards let you schedule reports to automatically land in your (or your client's) inbox without manual intervention every time.
Compare Relevant Timeframe
Last week vs. this week, this month vs. last month, year-over-year for seasonal businesses – context matters tremendously.
Works Wherever You Are
Whether you're at your desk, on your phone between meetings, or pulling up stats during a client lunch on your tablet, accessibility matters.
Dashboard Options Worth Considering
Google Data Studio (Now Looker Studio)
Free, connects directly to Google properties, and is surprisingly flexible once you get the hang of it. We use this for most of our smaller clients.
-
SEMRush Dashboard
If you're already paying for SEMRush, their dashboard functionality ties everything together nicely. Their competitive comparison features are particularly helpful.
-
BacklinkBot.ai
We started using this specifically for our link building campaigns. The visualization of link growth over time has been particularly useful for showing clients progress.
-
Ahrefs or Moz
Both offer solid built-in reporting. Ahrefs particularly shines for backlink monitoring, while Moz's local SEO dashboard components work well for our brick-and-mortar clients.
Custom Solutions
For our enterprise clients, we've built custom dashboards using Tableau. Overkill for most situations, but necessary when connecting proprietary datasets with SEO metrics.
Building Your Own Dashboard Without Losing Your Mind
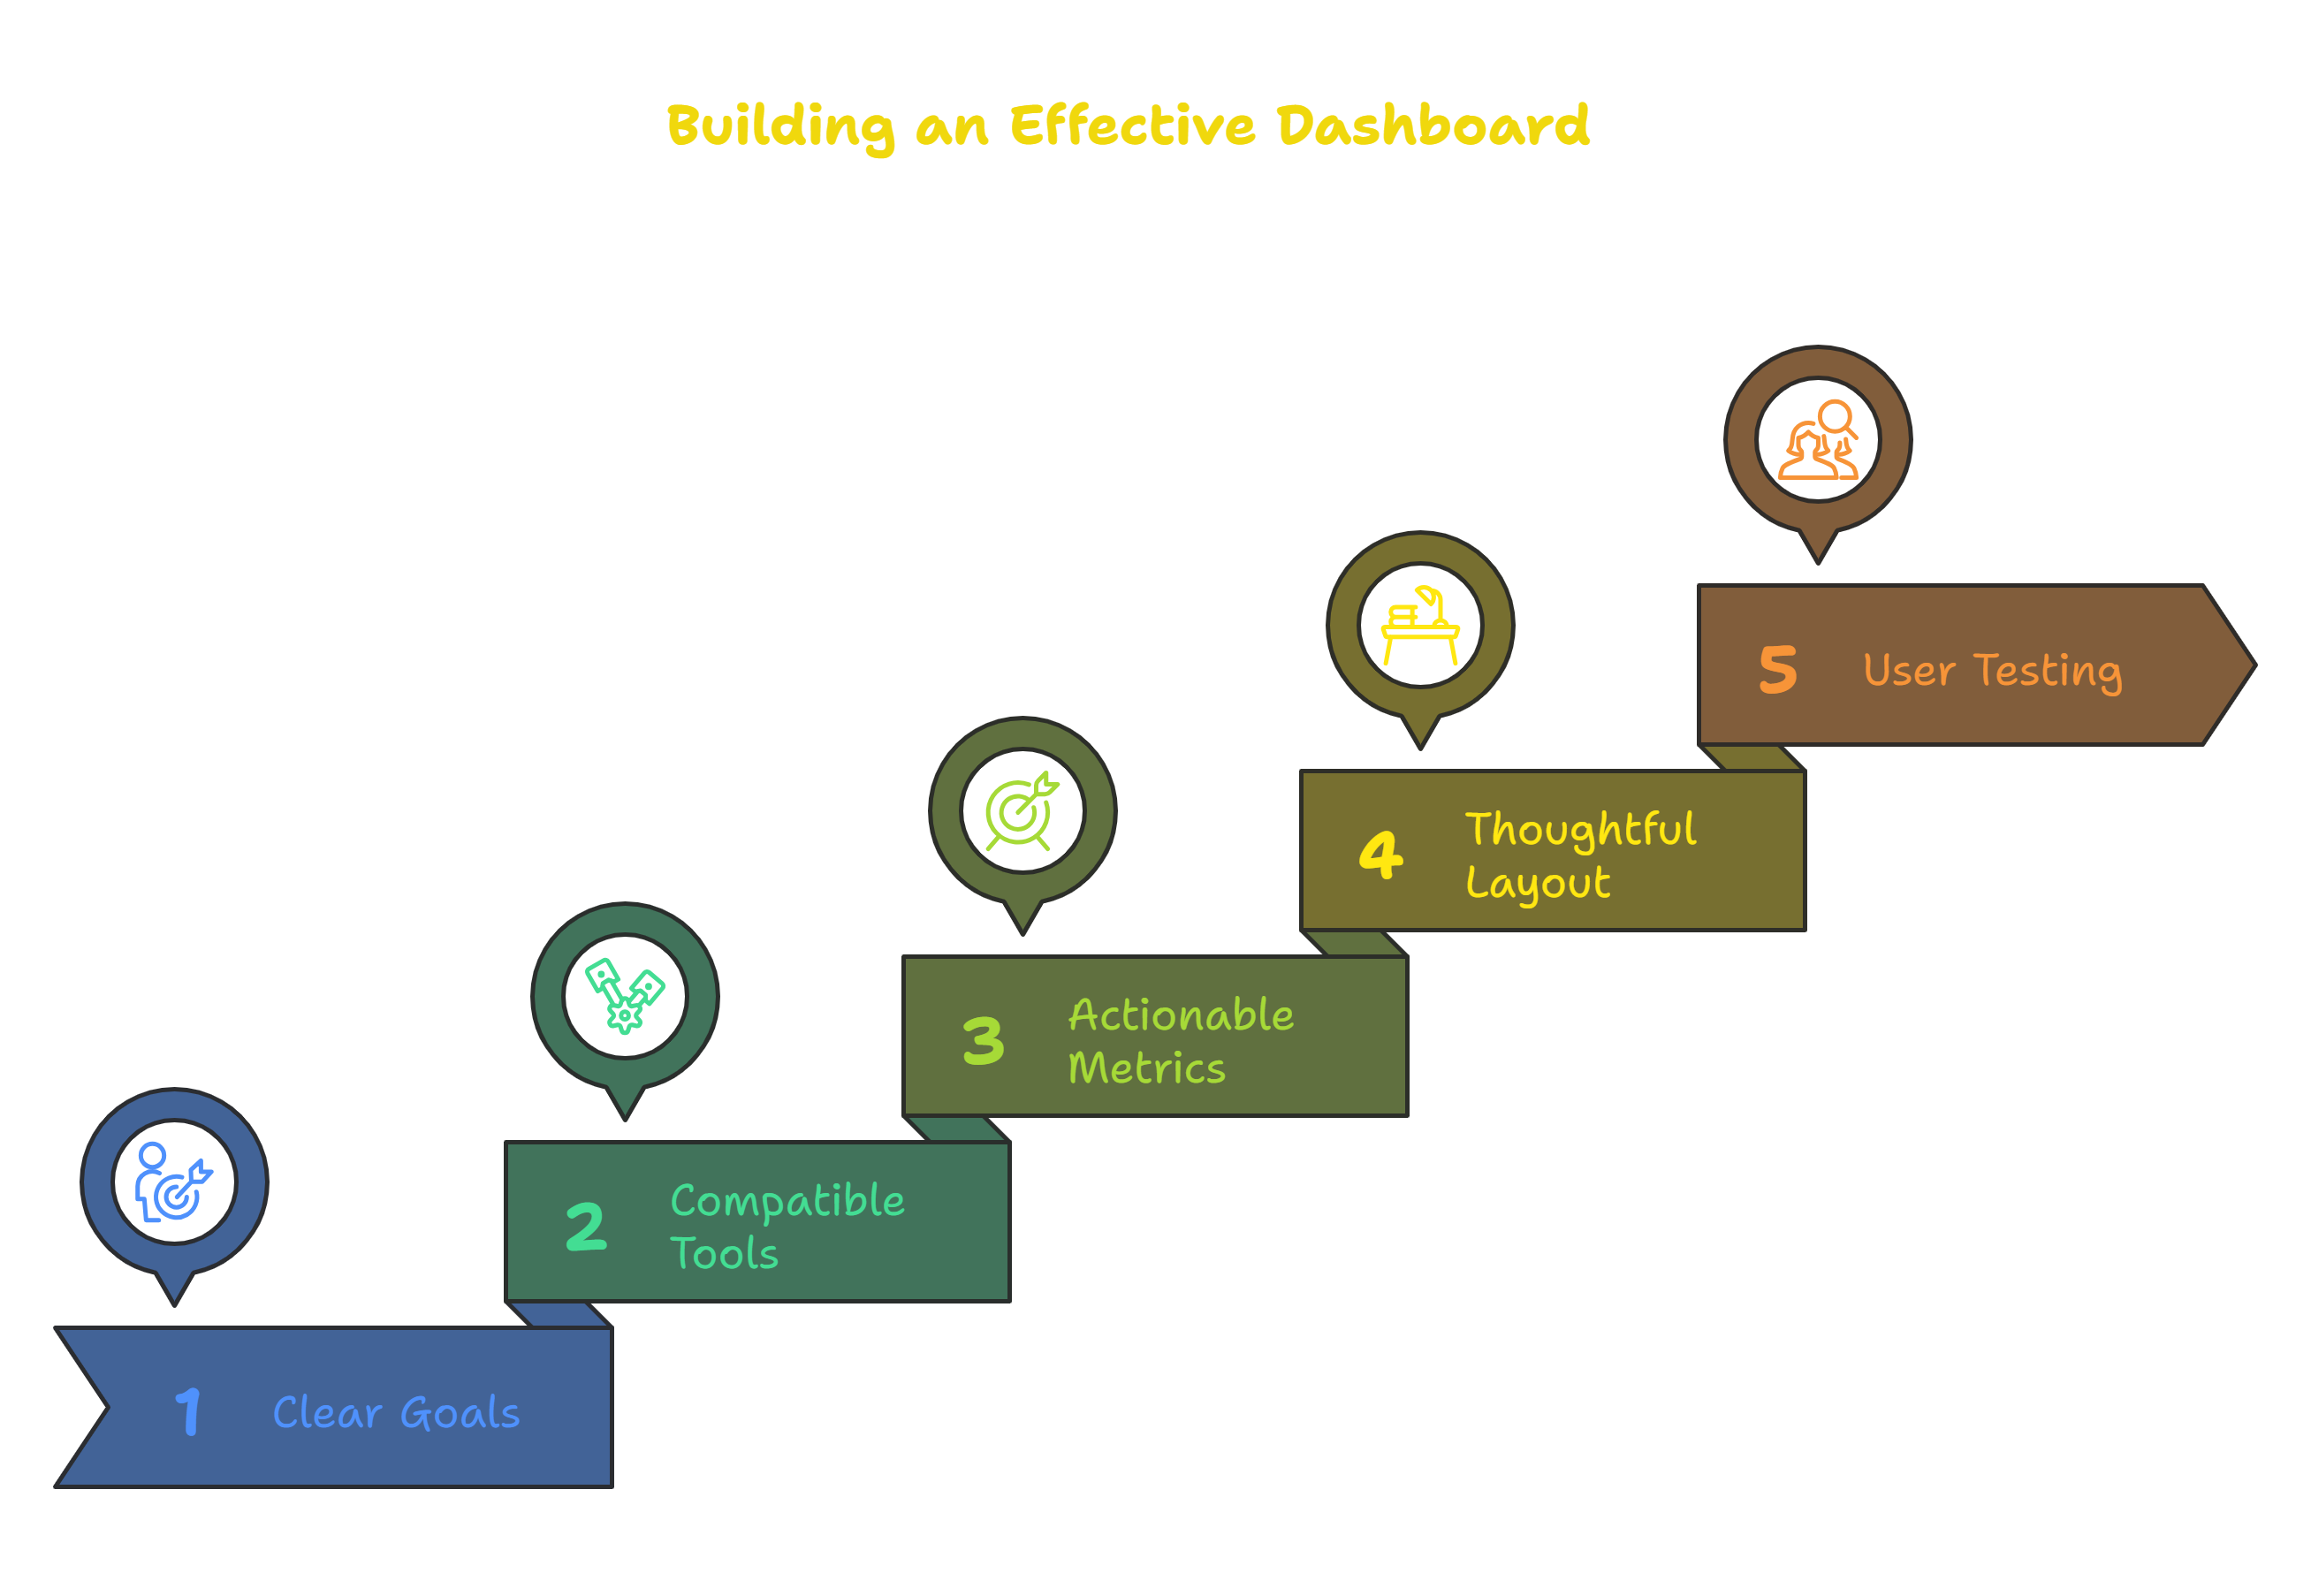
Start With Clear Goals
Before adding a single chart, ask: "What decisions will this dashboard help me make?" For our e-commerce clients, that's usually tracking category and product page visibility plus conversion rates.
Choose Tools That Actually Talk to Each Other
We learned this lesson the hard way. Before investing in any platform, verify it connects with your existing tech stack.
Pick Metrics That Drive Actions
Traffic is nice. Traffic that converts is better. Focus on metrics that connect to business outcomes, not just SEO vanity stats.
Layout Matters More Than You Think
Group related information together. Put the most critical metrics at the top left (where eyes naturally go first). Use consistent color schemes across similar metrics.
Test With Actual Users
What makes perfect sense to you might confuse clients or team members. Get feedback before finalizing.
Making The Most of Your Dashboard
Keep It Clean and Focused
Every time we're tempted to add another metric, we ask "will this change any decisions we make?" If not, it stays out.
Set a Review Schedule
Our team has 15-minute daily checks for urgent issues and deeper weekly reviews for trend analysis. Without a schedule, even the best dashboard becomes digital wallpaper.
Connect Metrics to Actions
For each key metric, establish thresholds that trigger specific responses. Traffic down 20% week-over-week? That initiates our technical audit protocol.
Compare Against Benchmarks
Raw numbers mean little without context. We track performance against industry averages, competitors, and historical data.
Common Dashboard Mistakes to Avoid
Trusting Dirty Data
Garbage in, garbage out. Regular audits of your tracking setup prevent making decisions based on faulty information.
Chasing Pretty Numbers That Don't Matter
Impressions look impressive on reports but mean little without corresponding traffic and conversions.
Using Generic Templates
Your business isn't generic; your dashboard shouldn't be either. Customize to track what actually matters to your specific goals.
Setting and Forgetting
Dashboards need regular maintenance as business goals evolve and search algorithms change.
Wrapping Up
A good SEO dashboard isn't just a pretty collection of charts – it's a decision-making engine. It transforms raw data into clear signals that guide your strategy and demonstrate your impact.
Whether you choose an out-of-box solution like BacklinkBot.ai or build something custom, the right dashboard will save time, improve communication, and ultimately drive better results for your website.
The best part? You'll finally stop dreading those end-of-month reporting sessions.
FAQs
-
What exactly is an SEO reporting dashboard and why should I care?
It's a visual command center that pulls all your website performance data into one place. You should care because it saves hours of report-building time and helps you spot problems before they become disasters.
-
What should my dashboard absolutely include?
Focus on organic traffic trends, conversion rates from organic visitors, keyword ranking movements, backlink growth, and technical health metrics like page speed and mobile usability.
-
Which dashboard tool is best for beginners?
Google's Looker Studio (formerly Data Studio) has the gentlest learning curve while still offering solid customization. Plus, it's free and connects easily with Google Analytics and Search Console.
-
How often should I actually look at my dashboard?
Quick daily glances for major issues, deeper weekly reviews for trends, and monthly analysis sessions for strategic planning. Set calendar reminders until it becomes habit.
-
Can a dashboard replace a human SEO professional?
About as well as a car dashboard can replace a mechanic. It tells you what's happening, but you still need expertise to understand why and determine the best response.


